Preparing vulnerability curves
To calculate the level of impact from a hazard event, users need to provide information on the vulnerability of different building types to the hazard measure used. The vulnerability describes the level of damage, given a specific intensity of the hazard. The level of damage is given as a monotonically increasing value between 0 and 1, and represents the ratio between cost of repair of a building, and the total replacement cost for that building.
The level of damage is variously described as “loss ratio”, “damage ratio” or “damage index”, though all have the same definition. Seismic engineers seem to use “loss ratio” more, while wind engineers seem to prefer “damage index”. This is really just a semantic issue and has no bearing on how HazImp performs its calculations.
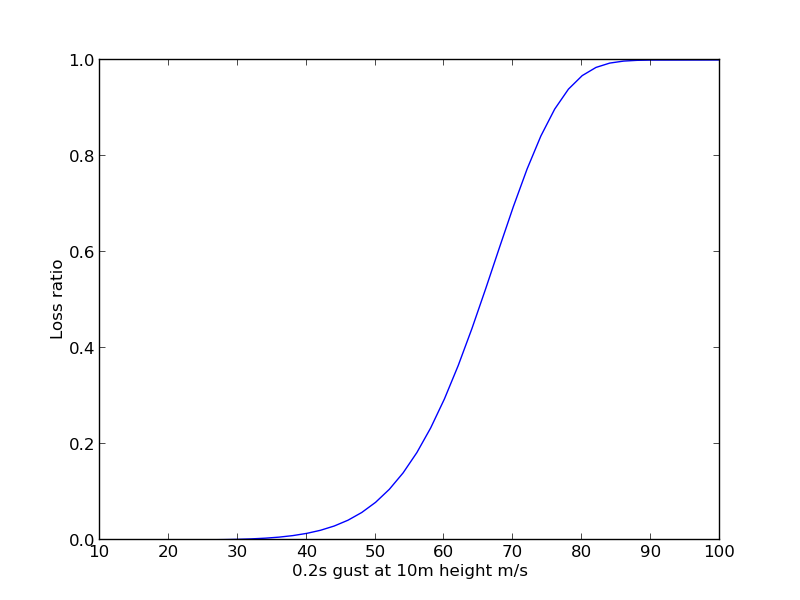
Fig. 2 An example vulnerability curve for severe wind impacts.
Vulnerability functions can be a functional form (e.g. a lognormal or Weibull curve), or a picewise-continuous linear function. Functions should be monotonically increasing for increasing hazard magnitude.
Format
The expected format of vulnerability functions is Natural hazard and Risk Markup language (NRML) 0.5, with the following schema:
<?xml version='1.0' encoding='utf-8'?>
<nrml xmlns="http://openquake.org/xmlns/nrml/0.5"
      xmlns:gml="http://www.opengis.net/gml">
    <vulnerabilityModel id="domestic_wind_2012" assetCategory="buildings" lossCategory="structural">
            <description></description>
            <vulnerabilityFunction id="dw1" dist="LN">
                <imls imt="0.2s gust at 10m height m/s">17.0 20.0 22.0 24.0 26.0 28.0 30.0 32.0 34.0 36.0 38.0 40.0 42.0 44.0 46.0 48.0 50.0 52.0 54.0 56.0 58.0 60.0 62.0 64.0 66.0 68.0 70.0 72.0 74.0 76.0 78.0 80.0 82.0 84.0 86.0 88.0 90.0 100.0</imls>
                <meanLRs>0 5.61E-05 0.000119676 0.000238983 0.000451491 0.000813598 0.001407546 0.002349965 0.00380222 0.005982567 0.009180008 0.01376939 0.020226871 0.029144114 0.041238619 0.05735623 0.078460253 0.10559985 0.13984902 0.182207241 0.233455211 0.293965791 0.363483019 0.440901669 0.524104006 0.60993153 0.694373629 0.773024088 0.841778089 0.897626918 0.93930181 0.967498609 0.98454129 0.99359009 0.997731405 0.999330795 0.999839797 1</meanLRs>
                <covLRs>0 0 0 0 0 0 0 0 0 0 0 0 0 0 0 0 0 0 0 0 0 0 0 0 0 0 0 0 0 0 0 0 0 0 0 0 0 0</covLRs>
            </vulnerabilityFunction>
    </vulnerabilityModel>
</nrml>
- The full XML schema definition is included in the source code at
resources/schema/openquake.
Vulnerability files are validated against the NRML 0.5 schema definition. If the file is not a vaild NRML file, an error will be raised. Note this validation does not do a complete check of the logical consistency of the values in the file. For example, NRML includes meanLRs and covLRs. The value of covLRs must be zero where the meanLRs values are zero. These internal consistency checks are not done by the validation check.
Structuring vulnerability functions
The folder hazimp_preprocessing/curve_data contains example formatted CSV files of vulnerability, which can be converted to the required XML format using the create_vuln_xml.py script.
The first row of the CSV file contains column labels, some of which are unique to each hazard. Key fields in the CSV include:
- `vulnerabilityFunctionID`
- `vulnerabilitySetID`
- `lossCategory`
- `defaultLoss`
- `IMT` - intensity measure type (the way the hazard is measured)
- `IML` - intensity measure levels (the hazard levels for which damage/loss ratios are provided)
Additional fields may be included to facilitate demarcation of
different vulnerability groups. For example, the
domestic_wind_vul_curves.csv includes fields of Region, Age,
AS4055_class, Roof material and Wall material. These attributes
are all used to assign an appropriate vulnerability curve to the
builiding. However, they are not used in the final XML dataset.
The vulnerabilityFunctionID value is a unique identifier to each
vulnerability function. These are used to assign a curve to each asset
contained in the input exposure data, and that column must be labelled
WIND_VULNERABILITY_FUNCTION_ID.
Generating a vulnerability xml file
Once an appropriate CSV file has been generated, the curve data is
converted to an XML file using the create_vuln_xml.py script. Edit
the lines below if __name__ == "__main__": to turn on the processing
of individual CSV files. For example, to process a CSV file called
domestic_wind_vuln_curves.csv, there should be a line like the
following:
if True:
    csv_curve2nrml('domestic_wind_vul_curves.csv',
                   'domestic_wind_vul_curves.xml')
Then run the script at the command line:
.. code:: sh
cd hazimp_preprocessing/curve_data python create_vuln_xml.py
This should generate a file called domestic_wind_vul_curves.xml in
the working directory (hazimp_preprocessing/curve_data). This xml
file can then be referenced in the Templates or a configuration
file to run HazImp.