User Guide
Introduction
HazImp is used to simulate the loss of value to structures from natural hazards using vulnerability curves. Generally the input information is hazard, such as a wind speed raster and exposure. The exposure information is currently supplied as a csv file, with structure locations given in latitude and longitude. This is combined with vulnerability curve information, described in an xml file. Figure 1.1 is an example of a vulnerability curve, showing a hazard value of the x-axis and the loss associated with that hazard on the y-axis:
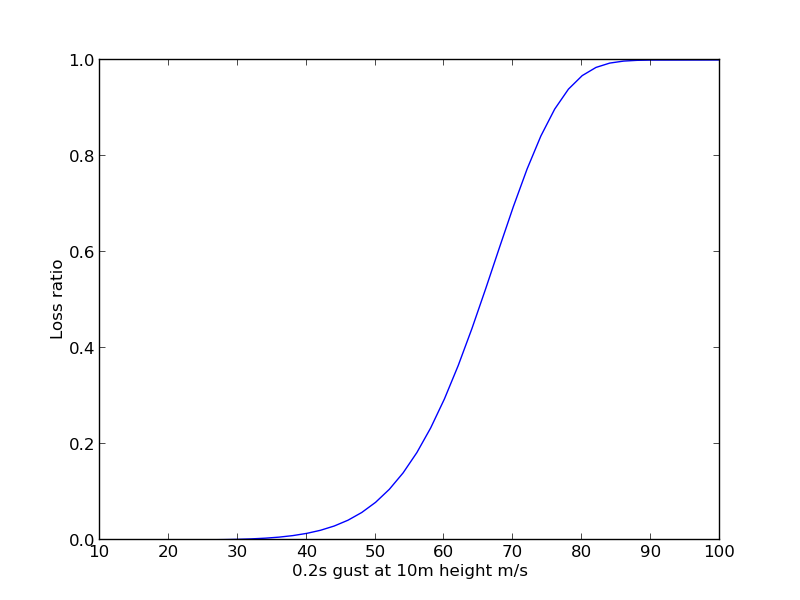
Fig. 1 An example vulnerability curve.
HazImp calculates a loss ratio value for each asset, based on the asset’s vulnerability and the magnitude of the hazard at the location of the asset. The loss ratio is the cost of repair divided by the total replacement cost of the asset. The loss ratio is also referred to as the damage ratio, or damage index.

Quick how-to
Follow the install notes in the README.md file.
A configuration file can be used to define a HazImp simulation. The configuration file is described using yaml, a data serialisation format. HazImp can also be used by another Python application, by passing the configuration information in as a dictionary.
For example, to run a wind example do:
cd examples/wind
python ../../hazimp/main.py  -c wind_v5.yaml
The -c specifies the configuration file.
HazImp can also be ran in parallel, using mpirun. For example:
mpirun -np 4 python ../../hazimp/main.py -c wind_v5.yaml
There are a suite of HazImp tests to test the install and code during software developement. To run these, in the root HazImp directory do;:
./all_tests
Templates
The simplest way to use HazImp is with a template. There is currently a wind template and a flood template. Templates take into account internal vulnerability curves and the data flow needed to produce loss information, simplifying the configuration file.
Note
The order of key/value pairs in the sample configuration files is important. The code will raise a RuntimeError if the order is incorrect.
Wind Template
Given a wind event footprint and point exposure data the loss associated with each site is calculated using the wind template.
Here is the example wind configuration file (from examples/wind), which uses the wind template.
#  python hazimp.py -c wind_nc.yaml
 - template: wind_nc
 - vulnerability:
    filename: domestic_wind_vuln_curves.xml
    vulnerability_set: domestic_wind_2012
    vulnerability_method: 'mean'

 - load_exposure:
    file_name: WA_Wind_Exposure_2013_Test_only.csv
    exposure_latitude: LATITUDE
    exposure_longitude: LONGITUDE
 - load_wind:
    file_list: gust01.nc
    file_format: nc
    variable: wndgust10m
 - calc_struct_loss:
    replacement_value_label: REPLACEMENT_VALUE
 - save: wind_impact.csv
 - aggregate:
    boundaries: SA1_2016_AUST.shp
    boundarycode: SA1_MAIN16
    impactcode: SA1_CODE
    save: gust01_impact.shp
 - save_agg: wind_impact_add.csv
The first line is a comment, so this is ignored. The rest of the file can be understood by the following key value pairs;
- template
The type of template to use. This example describes the wind_nc template. See docs/templates.rst
- vulnerability
This loads the vulnerability models for calculating the level of damage.
- filename
The name of the vulnerability model file to load. This is an xml file produced using hazimp_preprocessing/curve_data/create_vuln_xml.py
- vulnerability_set
A vulnerability file may contain multiple sets (the
vulnerabilityModelelement in the NRML schema) of vulnerability functions. This specifies which set of models to use.- vulnerability_method
HazImp can add a level of random variability to loss levels for an individual asset, as the curve typically represents the mean damage level in a population of buildings. Valid options here are
mean,normalornormal_uniform.meanwill return the value as defined in the vulnerability function.normalwill use the coefficient of variation defined in the vulnerability model and randomly vary the damage value using a normal distribution and the given coefficient of variation.normal_uniformwill return a random value, using the coefficient of variation multiplied by a random normal variable with zero mean and unit variance. All values will be bounded between 0 and 1. seeVulnerabilityFunction.get_loss()for details.
- load_exposure
This loads the exposure data. It has 3 sub-sections:
- file_name
The name of the csv exposure file to load. The first row of the csv file is the title row.
- exposure_latitude
The title of the csv column with latitude values.
- exposure_longitude
The title of the csv column with longitude values.
There are some pre-requisites for the exposure data. It must have a column
called WIND_VULNERABILITY_FUNCTION_ID which describe the vulnerability
functions to be used. It must also have a column called “WIND_VULNERABILITY_SET”
which describes the vulnerability set to use (see below for more details).
- hazard_raster
This loads the hazard data.
- file_list
A list of raster wind hazard files (one or more). The file format can be ascii grid, geotiff or netcdf (or potentially any raster format recognised by GDAL, but these are all that have been tested to date).
- file_format
This specifies the data format - specifically used for netcdf, where the string ‘nc’ should be used.
- variable_name
For use when the file format is ‘nc’. This specifies the name of the variable in the netcdf file that contains the hazard data.
- scaling_factor
For use when the hazard units do not match the units of the vulnerability function. e.g. hazard units are in cm, vulnerability function is in m scaling factor is 0.01.
- exposure_permutation
- groupby
The exposure attribute that will be used to conduct the permutation within. It is strongly recommended to use the same attribute as used for aggregation.
- iterations
The number of iterations of the permutation conducted.
- calc_struct_loss
This will multiply the replacement value by the
structuralvalue to get thestructural_loss.- replacement_value_label
The title of the exposure data column that has the replacement values.
- save
The file where the unit level results will be saved. All the results to calculate the damage due to the wind hazard are saved to file. The above example saves to a csv file, since the file name ends in .csv. This has the disadvantage of averaging data from multiple wind hazards. The information can also be saved as numpy arrays. This can be done by using the .npz extension. These data can be accessed using Python scripts and are not averaged.
Output
HazImp will calculate the loss ratio for each exposure asset and append that
value to the record for the asset as the structural attribute. The resulting
data are saved to a csv-format file defined in the configuration file:
- save: wind_impact.csv
If the calc_struct_loss configuration option is included, then HazImp will
calculate the loss value as the product of the loss ratio and the replacement
value of the asset. This will appear in the output file under the attribute
structural_loss, and will be available for inclusion in any aggregation:
- calc_struct_loss:
    replacement_value_label: REPLACEMENT_VALUE
Aggregation
- aggregation
This determines the way HazImp will aggregate the results (table output)
groupby The exposure attribute that will be used to aggregate results. It is strongly recommended to use the same attribute as used for the exposure permutation.
kwargs A list of fields that will be aggregated to the level identified above. Each entry under this section must match an output field (
structural,structural_loss,REPLACEMENT_VALUE), followed by a Python-style list of statisticts to calculate: e.g.mean,stdorsum:kwargs: structural: [mean, std] structural_loss: [mean, sum] REPLACEMENT_VALUE: [mean, sum]
- save_agg
The file where the aggregated results will be saved. This will save data to a csv-format file:
- save_agg: olwyn_agg.csv
- categorise
Categorisation of the structural loss ratio to damage state See docs/categorise.rst for examples
field_name The name of the created categorical field
bins Monotonically increasing array of bin edges, including the rightmost edge, allowing for non-uniform bin widths. There must be (number of labels) + 1 values, and range from 0.0 to 1.0.
labels Specifies the labels for the bins
- aggregate
This determines the way HazImp will aggregate results (spatial output)
boundaries Name of geospatial dataset that contains geographical boundaries to use for aggregation. file format options .shp, .json, .geojson, .gpkg
boundarycode Field name in the boundaries geospatial dataset
impactcode field name in the dataframe to aggregate
filename destination file name for the aggregated spatial output file format options .shp, .json, .geojson, .gpkg
categories Boolean option (True or False) to add columns for the number of buildings in each damage state defined in the ‘Damage state’ attribute. This requires that a ‘categorise` job has been included in the pipeline, which in turn requires the bins and labels to be defined in the job configuration file.
fields A dictionary with column names from the dataframe with lists of aggregation functions to apply to the columns For example:
- Fields:
structural: [mean] structural_upper: [mean] ‘Damage state’: [size]
Flood Template - Structural Damage
The structural damage flood template is very similar to the wind template. This is an example structural damage flood template;:
#  python ../../hazimp/hazimp.py -c list_flood_v2.yaml
# Don't have a scenario test automatically run this.
# Since the file location is not absolute,
- template: flood_fabric_v2
- vulnerability:
    filename: fabric_flood_vul_curve.xml
    vulnearbility_set: structural_domestic_flood_2012
- floor_height_(m): .3
- load_exposure:
    file_name:  small_exposure.csv
    exposure_latitude: LATITUDE
    exposure_longitude: LONGITUDE
- hazard_raster:  depth_small_synthetic.txt
- calc_struct_loss:
    replacement_value_label: REPLACEMENT_VALUE
- save: flood_impact.csv
The first 4 lines are comments, so they are ignored. The new key value pairs are;
- floor_height_(m)
This is used to calculate the water depth above ground floor, assuming a fixed floor height for all assets; water depth(m) - floor height(m) = water depth above ground floor(m)
- hazard_raster
A list of ascii grid hazard files to load or a single file. The file format is grid ascii. The values in the file must be
water depth(m), since that is the axis of the vulnerability curves.
Vulnerability functions
See the Preparing vulnerability curves section for guidance on preparing vulnerability functions for use in HazImp.
Provenance tracking
The provenance of information used in generating an impact analysis is tracked using the Prov module. This information is stored in an xml-format file alongside the other output files. A graphical representation of the connections between the components is also created.
Contributions to the code base should incorporate appropriate provenance statements to ensure consistency.